Join Free! Sign In UPLOAD
Science Science Math Math History History Social Studies Social Studies Language Arts Language Arts Educational Songs Kids Educational Songs
More
History Algebra Earth Science Geography Health PE Fractions Elementary Science Music Programming Languages Pre Calculus Chemistry Biology More
Open main menu TeacherTube.com
  • Join Free! Sign In UPLOAD
  • Close main menu

Remove Ads

Calculate 1-Variable Statistics on the TI-Nspire

High School / Math / Probability and Statistics

COMMONSENSE4THECORE

Nov 17, 2016

1582 views

Probability and Statistics

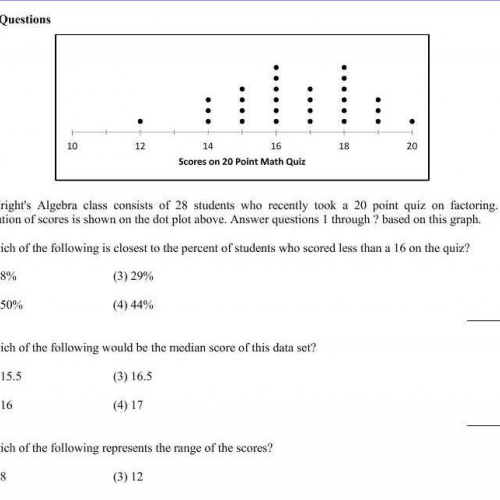
How to enter data and calculate one-variable statistics on the Texas Instruments Nspire. The question being solved is below: The number of goals scored d by Wayne Gretzky and Mario Lemieux during their first 8 seasons are listed below. Wayne Gretzky: 51, 55, 92, 71, 87, 73, 52, 62 Mario Lemieux: 43, 48, 54, 70, 85, 45, 19, 44 Which set of statements about the mean and standard deviation is not true? (1) mean Wayne Gretzky > mean Mario Lemieux, AND standard deviation Wayne Gretzky < standard deviation Mario Lemieux (2) mean Wayne Gretzky standard deviation Mario Lemieux (3) mean Wayne Gretzky < mean Mario Lemieux, OR standard deviation Wayne Gretzky mean Mario Lemieux, OR standard deviation Wayne Gretzky > standard deviation B

Remove Ads

Remove Ads

Related categories

High School
Math
Binary Number System
Calculus
Geometry
Logic and Set Theory
Number Operations
Podcasts
Pre-Algebra
Pre-Calculus
Trigonometry
High School > Math > Probability and Statistics
MMMR Song
MMMR Song
Gr8 Mod6 Lesson13
Gr8 Mod6 Lesson13
Excel Analysis 2
Excel Analysis 2
Statistics Part 1 (Revised)
Check 9-4
Check 9-4
Check 9-3
Check 9-3
Check 9-2
Check 9-2
Check 9-1
Check 9-1
Making Predictions
Making Predictions
Unit 10 Statistics Review
High School > Math
Range of Transformation
Domain of a Transformation
Video2: perpendicular SLOPE
Perimeter and Area using ALGEBRA
Video4:Graph Lines y= -9/10x
Constructions Instructional Video
Graphing Quadratic Inequalities on Desmos
Graphing Quadratic Inequalities on ...
How to Teach the Sum of Consecutive Natural Numbers
How to Teach the Sum of Consecutive...
Order of Operations
Order of Operations
Arroyo - PER 2
Arroyo - PER 2
High School
PersonalFinanceLab: Setting and Keeping Savings Goals in the Budget Game
PersonalFinanceLab: Setting and Kee...
Video2: perpendicular SLOPE
Perimeter and Area using ALGEBRA
Video4:Graph Lines y= -9/10x
Review Reminder for Finals
Why Invest
Why Invest
How to assemble the Sky Goodies Mini Hot Air Balloon Lamp Shade
How to assemble the Sky Goodies Min...
Graphing Quadratic Inequalities on Desmos
Graphing Quadratic Inequalities on ...
How your mental state affects your unborn child
How your mental state affects your ...
How to Teach the Sum of Consecutive Natural Numbers
How to Teach the Sum of Consecutive...
  • Contact Us
  • Help and FAQ
  • Privacy Policy
  • Terms
  • California - Do Not Sell My Personal Information
  • California - CCPA Notice
© 2025 TeacherTube. All Rights Reserved.